I upgraded ojs 3.0.2 to ojs 3.1.1 successfully but the submission list not appeared also the following error message appeared:
##api.submissions.unknownError##
The php version is 5.6 and localization settings as follow:
; Default locale
locale = en_US

; Client output/input character set
client_charset = utf-8

; Database connection character set
; Must be set to "Off" if not supported by the database server
; If enabled, must be the same character set as "client_charset"
; (although the actual name may differ slightly depending on the server)
connection_charset = utf8

; Database storage character set
; Must be set to "Off" if not supported by the database server
database_charset = utf8

; Enable character normalization to utf-8 (recommended)
; If disabled, strings will be passed through in their native encoding
; Note that client_charset and database collation must be set
; to "utf-8" for this to work, as characters are stored in utf-8
charset_normalization = Off
Moreover, the permission of the folders “cach”, “api” and “files” is 755. Also, by using the web browser tool, the error as follow:
Failed to load resource: the server responded with a status of 404 (Not Found)
ModalHandler.js:214 Uncaught TypeError: Cannot read property ‘trigger’ of undefined
at proxyConstructor.$.pkp.controllers.modal.ModalHandler.modalOpen (ModalHandler.js:214)
at $e.ajaxErrorCallback (build.js:6)
at Object.error (build.js:1)
at fire (jquery.js:3099)
at Object.fireWith [as rejectWith] (jquery.js:3211)
at done (jquery.js:9312)
at XMLHttpRequest.callback (jquery.js:9720)
ModalHandler.js:204 Uncaught TypeError: Cannot read property ‘addClass’ of undefined
at ModalHandler.js:204
ModalHandler.js:210 Uncaught TypeError: Cannot read property ‘focus’ of undefined
at ModalHandler.js:210
/ojs311/index.php/jast/api/v1/_submissions?journal=jast&endpoint=/jast/api/v1/submissions&status=1&assignedTo=-1&searchPhrase=&count=20&offset=0&=1523024730475 Failed to load resource: the server responded with a status of 404 (Not Found)
/ojs311/index.php/jast/api/v1/_submissions?journal=jast&endpoint=/jast/api/v1/submissions&status=1&searchPhrase=&count=20&offset=0&=1523024730476 Failed to load resource: the server responded with a status of 404 (Not Found)
2ModalHandler.js:214 Uncaught TypeError: Cannot read property ‘trigger’ of undefined
at proxyConstructor.$.pkp.controllers.modal.ModalHandler.modalOpen (ModalHandler.js:214)
at $e.ajaxErrorCallback (build.js:6)
at Object.error (build.js:1)
at fire (jquery.js:3099)
at Object.fireWith [as rejectWith] (jquery.js:3211)
at done (jquery.js:9312)
at XMLHttpRequest.callback (jquery.js:9720)
2ModalHandler.js:204 Uncaught TypeError: Cannot read property ‘addClass’ of undefined
at ModalHandler.js:204
2ModalHandler.js:210 Uncaught TypeError: Cannot read property ‘focus’ of undefined
at ModalHandler.js:210
and the error log file is empty. I wish any body help me to prepare this issue.
I am getting the same error both in 3.1.0-1 and 3.1.1. It consistently appears when I do this: (1) log in as journal manager, (2) select settings->journal. This error then pops up for a moment before the journal settings page appears.
There is nothing in the web log, php log, or postgres log, so a javascript error is the most likely problem. I’m using Firefox in case that matters.
Trying the same steps in Safari, I get the javascript error “TypeError: undefined is not an object (evaluating ‘$handledElement.addClass’)” at line 204 of ModalHandler.js, and “TypeError: undefined is not an object (evaluating ‘$handledElement.focus’)” at line 210 of ModalHandler.js.
I solved this issue by moving my website to a new host which contains a new version of php (7.1). The old hosting account have the versions 5.4 & 5.6. So, I think the problem in the version of php.
After upgrading from php5.6 to php7.2.4, I still have the same problem (maybe an extra error message, I’m not sure it wasn’t there before). Here are the tracebacks.
[Error] TypeError: undefined is not an object (evaluating '$handledElement.trigger')
	modalOpen (ModalHandler.js:214)
	ajaxErrorCallback (build.js:6:36867)
	ajaxErrorCallback
	error (build.js:1:46208)
	fire (jquery.js:3099)
	fireWith (jquery.js:3211)
	done (jquery.js:9312)
	callback (jquery.js:9720)

[Error] TypeError: undefined is not an object (evaluating '$handledElement.addClass')
	(anonymous function) (ModalHandler.js:204)

[Error] TypeError: undefined is not an object (evaluating '$handledElement.focus')
	(anonymous function) (ModalHandler.js:210)
@bdm to get some clarity on your issue, can you try the following:
Login as journal manager.
Wait on the page for a while to see if any error messages appear.
If you get the modal saying ##api.submissions.unknownError## or text saying there was an unknown error, please check the other tabs on your dashboard (Unassigned, Active, Archived) and let me know if any of the tabs appear.
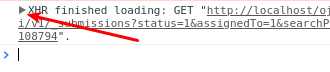
Please open your browser’s developer tools and locate the Network tab, then look for XHR requests. You should see some which say GET and may have an error 500. If you receive any of those, you can inspect the results and let me know what it says.
@NateWr Thanks. Now I’m on a different computer (a 2012 Mac with latest OS, Safari and Firefox).
On Safari I have not seen the ##api.submissions.unknownError## message, just the javascript errors I noted above. It’s possible that the message just disappears too quickly to see; on Firefox it pops up (in a little window) and goes away so quickly that I had to record the screen to read it.
From now on I’m running Firefox 59.0.2. The cache is turned off and I have the Developer Console open.
Just navigating to the login page, without logging in, gives “Empty string passed to getElementById(). jquery.js:2778:12” That script comes from ajax.googleapis.com.
Login as journal manager, no messages and everything looks normal.
Logout (without doing anything). About 2 in every 3 times, the ##api.submissions.unknownError## message pops up for a moment and the console says
TypeError: $handledElement is undefined ModalHandler.js:214:3
TypeError: $handledElement is undefined ModalHandler.js:204:4
TypeError: $handledElement is undefined ModalHandler.js:210:4
Looking in the Network tab, there is a status 302 GET for file “signOut”. Otherwise there are only 200s. There are no XHR requests shown at all.
Now login again. Nothing happens if I just wait. Everything looks normal.
Select Settings->Journal. About 3 in every 4 times the message ##api.submissions.unknownError## pops up for a moment and the same 3 js errors appear. Going backwards and forwards from the initial view to Settings->Journal produces the same errors (but not every time). Now I see 4 XHR GET requests (all 200) and one XHR POST request (also 200).
Logout, login. tabs Unassigned, All Active, and Archives all bring up lists without any errors noted. Now there is one more XHR request (fetch-grid, status 200).
Huh, so you don’t actually receive errors until you browse away from a page? That’s really baffling.
In Chrome, when an error message appears in the console, you’ll usually see a small arrow on the left.
When you click it, it should give you a full backtrace of the calls which led to the error. Would you be able to take a screenshot of that and share it?
I’m not even sure if the TypeError messages are related to the ##api.submissions.unknownError##, but I don’t know where else to start…
Sorry I should have updated you on that. Yes, I played a little with PHP configuration and found a way to make the 500 error go away. It is a little complicated. I am running production on 2.3.3 which doesn’t work with PHP 5.6 but my 2.4.8 and 3 require PHP 5.6. I tried different combinations of .htaccess and php.ini, and found a good mix that works for all versions. Thanks.
@NateWr When the ##api.submissions.unknownError## messages appears for me, no php error appears in the log. I’ve looked multiple times. My php is 7.2.4 and it is configured to report warnings and up.
As you requested above, I used Chrome (latest Linux edition) to record traffic. You can fetch the log from this url. Because I’m giving this link publicly, I edited the domain name to HOST and the journal abbreviation to JOURNAL. The actions recorded are: Log in as journal manager; select Settings->Journal. During this sequence, the ##api.submissions.unknownError## message appeared (but the Chrome log doesn’t show it) and a few javascript errors occurred.
Since this system is so far just in test mode, I can run experiments. For example, if you provide an instrumented version of ModalHandler.js (which produces the javascript errors), I can try it. I don’t speak javascript myself.
@bdm this is the log for the browser events. But if you’re getting the API error, you’re probably running into a fatal error on the server. You’ll need to check the server logs for errors.
@Paul_Chen great, it was probably just some cache that needed to clear.
@NateWr I created the error about 6 times in quick succession. In apache2/error.log, tons of these warning messages and nothing else. In apache2/access.log some successful GETs and some 404s from missing favicons, and nothing else. In the postgres error log, nothing. I don’t know where else to look.
I’m sorry, I don’t know how else to help. If you’d like to send me the entire error log file via PM, I’ll search for any fatal errors (they’re easy to miss with all the warning messages).