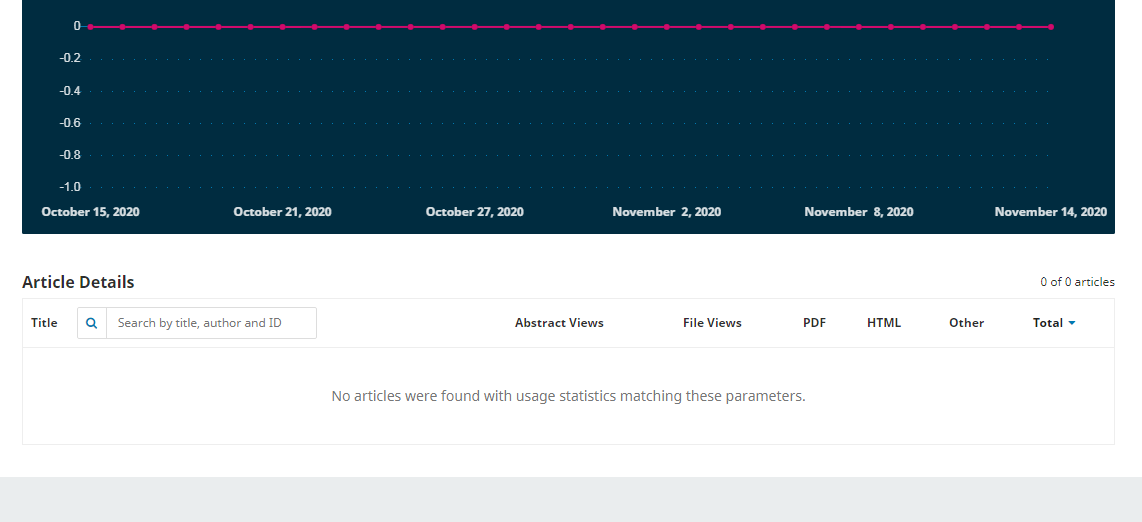
Our journal editors would like to have some usage stats. I have tried to use the built-in “View Report” from “Tools”. However, I’m getting 0s for a newly created journal (i.e., a few months old), and 500 internal server error message for the other two older journals. I can see the usages are being recorded in the usageEventLogs folders, but for some reasons, they are not showing up in the downloaded excel reports.
Thanks. Our IT has stopped logging PHP logs. I will ask them to restart again. At the meantime, do you have any idea why the downloaded “View Report” for the newer-ish journal is all '0’s?
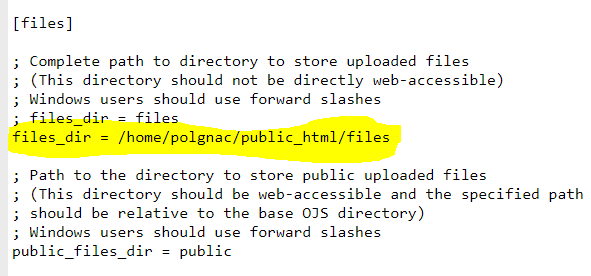
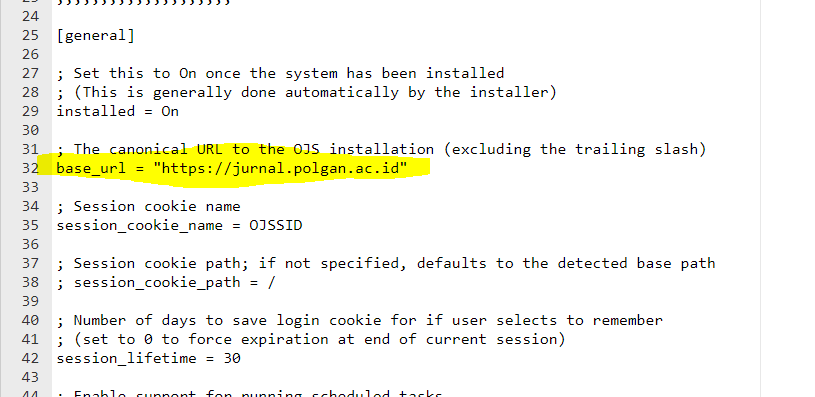
Check that your base_url in config.inc.php is set correctly, and see if there is anything useful in the usageStats/usageEventLogs directory (inside your OJS files_dir).
Regards,
Alec Smecher
Public Knowledge Project Team
Thanks for the reply. I have checked the base_url is correct. and I can’t see anything useful in the usageEventLogs files… It seems to have recorded my test visits… see below. Can you tell anything unusual from the logs below?
In my case, this db metric has stopped work since OJS 3.1.1-4 and now I upgrade my OJS version to 3.2.1-1 and this db metrics still didn’t updated data.
I don’t know how to make it work. so many discuss about this but no solution.
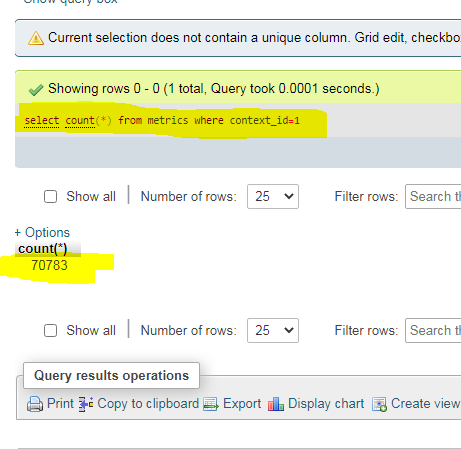
In your SQL database, see if there are any rows for in the metrics table for this journal. So if the journal id is 1, use the following SQL:
select count(*) from metrics where context_id=1
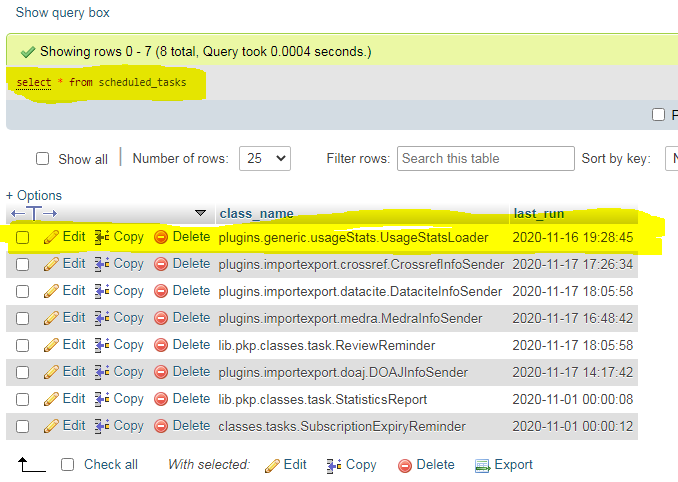
If there are no metrics, your instance may not be set up to process the usage stats logs. Check to see if there is a scheduled task registered for this:
select * from scheduled_tasks;
You should see a listing for plugins.generic.usageStats.UsageStatsLoader.
If you do have that listing, your instance may not be running its scheduled tasks. Read our documentation on how to configure scheduled tasks.
If you do not have that listing, your instance may not have the correct plugins installed. Read our documentation on how to configure the statistics framework.
It looks like the UsageStatsLoader is running (the last run was yesterday). My best guess is that there are no log files being written or the plugin is not finding the log files for processing.
I’d recommend looking in your files_dir (defined in config.inc.php) and look for the usageStats directory. For example, if your files_dir is /var/www/files, look at the files in:
/var/www/files/usageStats`
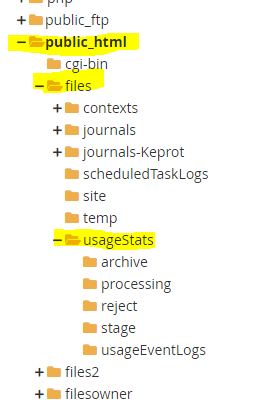
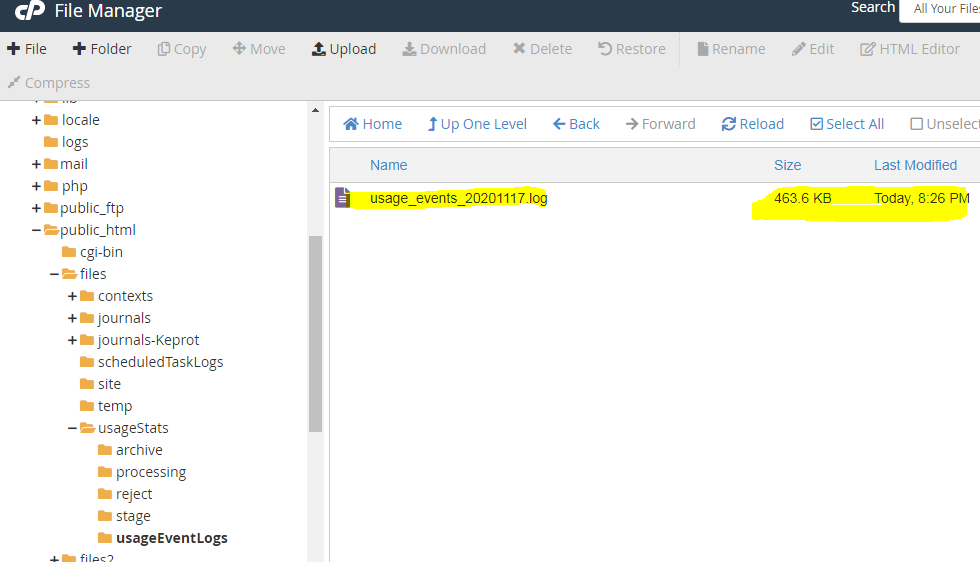
In particular, look for log files in:
/var/www/files/usageStats/usageEventLogs
When the usage stats are processed, they are taken out of this directory for processing. That means you should only see logs since the last run.
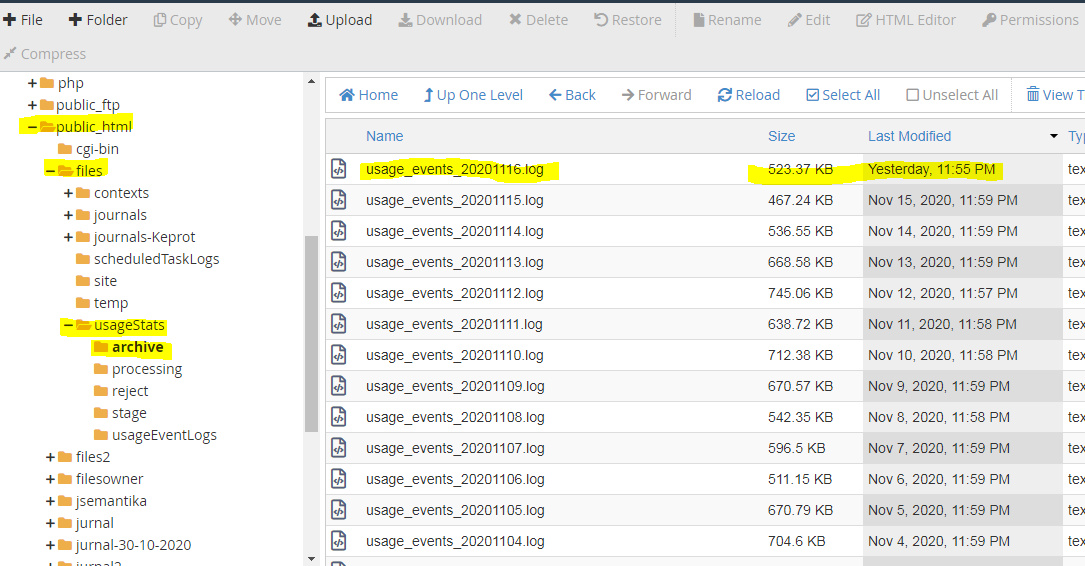
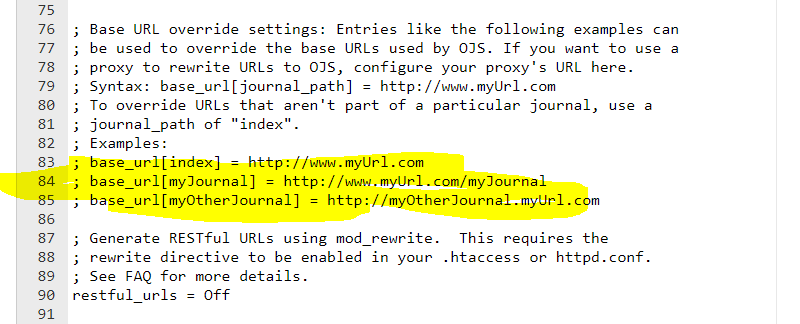
Hmm, and what about the usageStats/archive directory. Do you have logs for all of the old dates in there? Also, what does the base_url setting in your config file look like?
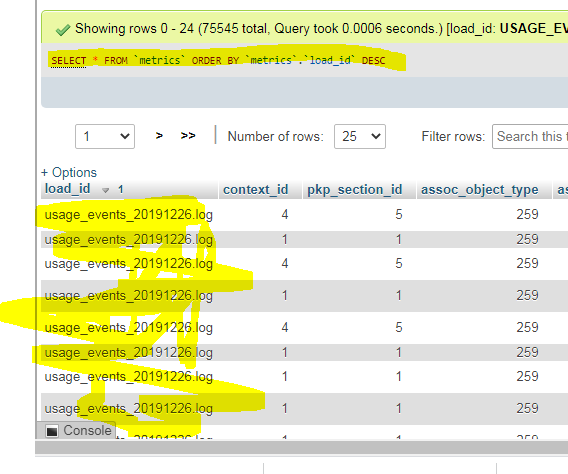
Ok, sorry, but I misread your output when counting the metrics table a few posts back. It looks like you have 70,000+ rows in the table. Let’s see if any of them are from the juripol journal. Try:
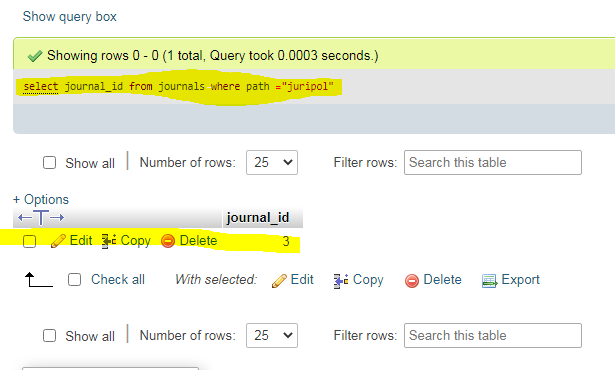
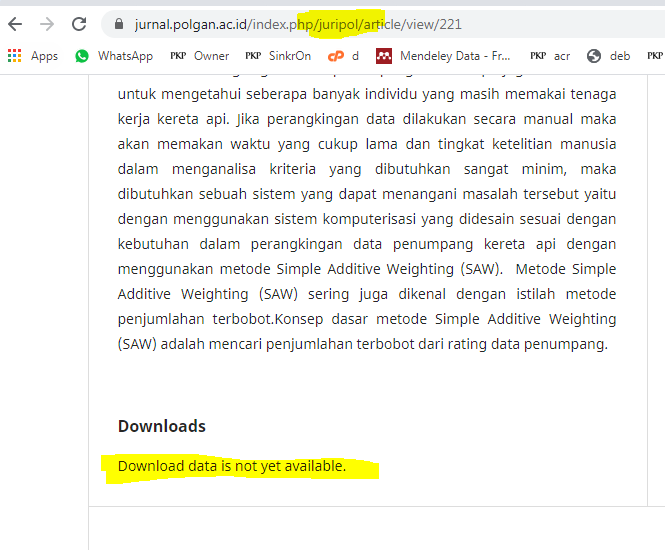
select journal_id from journals where path="juripol";
That should be 1. If so, try:
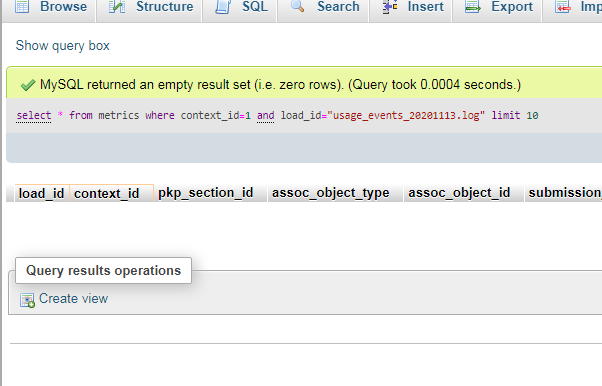
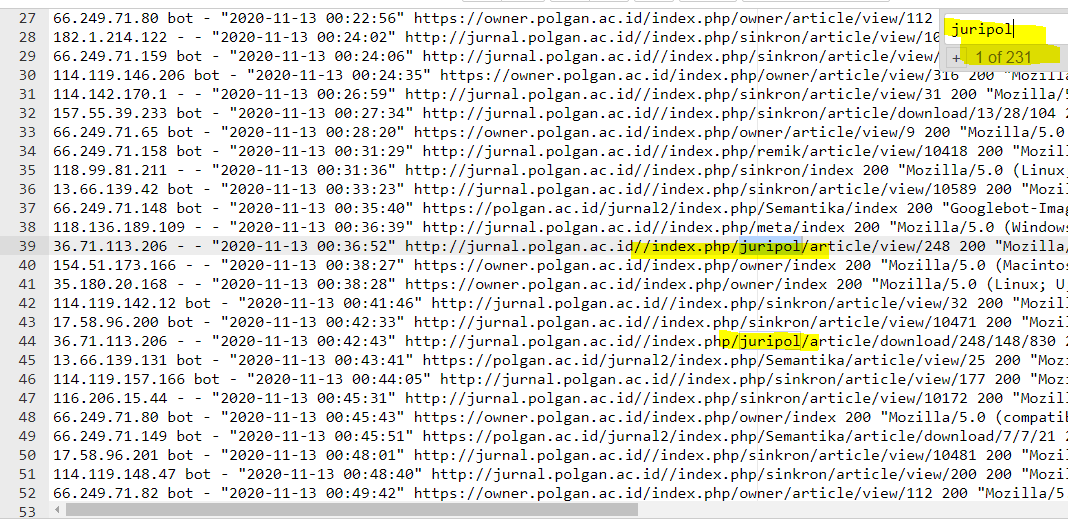
select * from metrics where context_id=1 and load_id="usage_events_20201113.log" limit 10;
If there are no entries for that, open up usageStats/archive/usage_events_20201113.log and see if there are any entries for the juripol journal.
Ok, so journal 1 has the path sinkron. Can you double-check that the log entry for Nov 13 had some entries for this journal?
It seems like they are not getting stored in the metrics table. I’m not sure what exactly is happening, but at this stage you’ll need to try processing some sample usage event logs to debug.
For example, I nnotice that the URLs for the journal sinkron all contain a double slash before index.php:
http://jurnal.polgan.ac.id//index.php/sinkron/...
If you process the logs without that slash, do you get entries in the metrics table?
Our Admin Guide includes a section on how to process log files. (The important thing to note is that you may need to move the log files out of the archive directory – I recommend just creating a small dummy file with sample usage events rather than the whole thing, while you debug.)