OJS Usage Statistics

Hello everyone,

OJS 3.0.2
I’ve noticed that the statistics are not displayed in the articles. The upgrade process was tricky but in the end everything went well and now I notice that the usage logs files after the upgrade are in the usageEventLog folder and not being processed to the archive folder (where the logs prior upgrade are). The plugin is active so what could be causing this, or what is the problem?

Thank you,
Best regards

Hi @digitojs

Could you take a look in your DB table scheduled_tasks, when was the UsageStatsLoader executed for the last time?
Also, could you take a look in your scheduledTaskLogs folder (in the files_dir) – there should be the log files with the name Usagestatisticsfileloadertask… Could you take a look at those recent ones and see if there is any error message there?

Best,
Bozana

Hi @bozana,

Thank you for you help.

  1. In DB table scheduled_tasks:

plugins.generic.usageStats.UsageStatsLoader 2017-06-28 17:23:34

  1. There are no Usagestatisticsfileloadertask files, only ReviewReminder…

Usage Statistics and Acron plugin are enabled in administrator profile, but Acron isn’t enabled for each journal. Could this be the issue? When performing the upgrade I remember I had to turn off the acron for some reason, or that it should be off.

Best regards

Hi @bozana,

I had no development regarding this, the log file isn’t generate and the events logo aren’t processed. Any idea?

Thank you for your time,
Best regards

Hi @digitojs

Hmmm… strange… because apparently the scheduled tasks is correctly triggered for execution…
Could you double check that the usage statistics plugin is enabled for all journals?
Also, are there maybe any log files in other folders, e.g. usageStats/reject or processing or stage?
Are the file permissions in those folders usageStats/ and scheduledTasksLogs/ correct?
If the plugin is enabled for all journals and there is no log file in those other folders: could you try to delete the entry UsageStatsLoader from your DB table scheduled_tasks and then go to an article page to trigger the Acron plugin i.e. that scheduled task again. Then see what is happening. Please see also your error log files, if there any error occurred.

At the moment I have no idea why is it so… :-\

Best,
Bozana

Hello @bozana,

I’ve checked the usagestats folder and the scheduletsk folder and it was, oddly, a permissions and user problem. After that correction, the Usagestatisticsfileloadertask are created and the usage_events logs are processed. But some logs that are kept in reject folder, older files.

Although the tasks are operating and the files processed, after making some tests, the statistics graphs do not appear, or only for one journal. I tested with articles that had no views, and after a couple days still nothing.

The usage statistics plugin is enabled for all journals.
Acron plugin enabled in “Admin” mode, but disabled for each journal.
Crontab for running tasks.

I haven’t tried your last suggestions because the original problem was solved, the tasks and logs are functional, and I have no errors in log related to it.
Any suggestion @bozana?

Thank you again,
Best regards

Hi @digitojs

Ah, OK, glad you solved it!

You could move those files from reject folder into the usageEventLog folder and try to process them again. If they are rejected again, see in the latest log file in the scheduledTasksLogs folder, if there is any hint/message what is going wrong. Maybe to do that file per file.

For those journals that do not have the statistics displayed on the article page: Could you see in the DB table metrics if there is any entry from this year 2017 for any article of that journal – the submission_id would be the article ID, the assoc_type has to be 515 (galleys)?

Best,
Bozana

Hi @bozana,

I moved the files to usageEventLog folder and I’ll keep record of the results.

I’ve looked in the DB for the metrics of the journals and there are some journals with no entries at all. And others have entries with assoc_type 256, 515 and 1048585. I understand this has to do with the older counter and statistics, because it is very irregular how the journals have this information and how it should be processed.
Only one journal is displaying the statistics in the article page.
How can I parse or translate those metrics?

Thank you,
Best regards

Hi @digitojs

Those assoc_type means:
256 - Journal (home page)
515 - Galley (downloads)
1048585 - Article (abstract view)
Looking at the column assoc_id you can figure out the object in question i.e. journal, galley, article.
Additionally, if exist, the object’s article ID (column submission_id), galley ID (column representation_id), journal ID (column context_id) can be found.
Column assoc_object_type and assoc_object_id is the issue i.e. issue ID.
Column metric_type should be ojs::counter – the one from the usage statistics plugin and that is considered in the graph on the article view page.
In the column day and month you can find out the date i.e. the year – the graph only considers the current (2017) year.
The load_id corresponds to the usage stats log file.

Hmmm… I do not know why some journals have no entries in the table metrics in your case :-\ Maybe you could try to test and debug it now – if it is working correctly now – to make a few access tests, to watch how they are logged and then processed and saved in the table metrics ?

Best,
Bozana

Best

1 Like

Hi @bozana,

Thank you for your attention to this issue.
About the rejected log files. The files were corrupted because some ending lines were incomplete, but I manually deleted those lines I it should be fixed.

About the statistics, and as I said before, only one journal is recording and keeping stats and I don’t understand why.
In metrics table that particular journal is the only one with entries, and this is since the end of 2014 when OJS 2.4.5 upgrade was made. I understand a problem would appear here, but it is weird that just one journal kept recording. Previous that date there are more logs and records of statistics. Is it possible to recover the old stats?
In usage_events_logs each access is recorded (status 200), of any journal, not only the “functional” one, but when processed only that journal is inserted in DB. I don’t see any error or unexpected behavior. Any suggestion?

Thank you,
Best regards

Hi @digitojs

Hmmm… strange… :-\

How are the URLs of your journals? The standard URLs like your-domain.com/index.php/journalPath ? Or have you maybe did any configuration to remove index.php or use other domains for journals or … ?

I think it is possible to reprocess the old stats, but I would first try it all in a test environment/copy…

Best,
Bozana

1 Like

Hi @bozana,

Thank you for your answer.
Your observation was precious because I noticed something.
In config.inc.php:

and in .htaccess, rules for “that” journal, and others:

  • RewriteRule ^journalPath(.*)$ /index.php/journalPath$1 [L]

I’ll add the base_urls for every journal and see how it processes.

To test the old stats I would appreciate your help but I want to adjust a test environment first.

Thank you,
Best Regards

Hello,

since the changes, it processes and counts the statistics of each journal. But only downloads, not page or abstract views. I’ve searched the forum but didn’t get the right procedure to display all the stats.

Thank you,
Best regards

Hi @digitojs

Hmmm… So what happens when you visit an abstract page? Do you see the correct URL in the usage statistics log? If you see that, do you see the entry for that date/log file in your DB table metrics with assoc_type = 1048585 and that submission_id?
In case you mean the graph displayed on the article page: there, only galley downloads are considered.
What do you mean with page views?

Best,
Bozana

Hi @bozana
Refer to what you have explained, I have checked my file_dir and DB
In my file_dir, I found ScheduledTaskLogs folder contains (top bottom)

In my DB, I found in metric table

and scheduled task as follow

Download stats is displayed Pengembangan perangkat pembelajaran matematika dengan pendekatan kontekstual budaya Lombok | Beta: Jurnal Tadris Matematika
My questions are:

  1. What I found in file_dir and DB, do they look normal?
  2. How abstract views can also be displayed in my journal?

I am using 3.0.1
Thanks

I have read your suggestions in this Article statistics showing 0 abstract views and 0 PDF downloads - #2 by bozana

(1)
The code changed in OJS 3.0.1, so it cannot be used as it is. You will have to change the function getViews in classes/article/ArticleGalley.inc.php to be like this:

function getViews() {
	$application = PKPApplication::getApplication();
	if (!$this->getRemoteURL()) {
		return $application->getPrimaryMetricByAssoc(ASSOC_TYPE_SUBMISSION_FILE, $this->getFileId());
	} else {
		return 0;
	}
}

DONE

(2)

Furthermore, there is currently no getViews function for articles. If you want to use it, you will have to add the following function to your classes/article/Article.inc.php:

function getViews() {
	$application = PKPApplication::getApplication();
	return $application->getPrimaryMetricByAssoc(ASSOC_TYPE_SUBMISSION, $this->getId());
}

I HAVE ADDED IT

For (3) and (4) I don’t understand

(3)
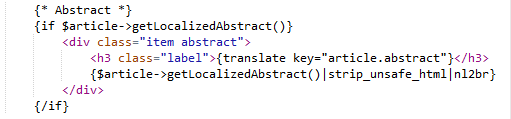
Also, you do not need the line {if is_a($article, ‘PublishedArticle’)}… in article_details.tpl, so there it should be something like:

{translate key="article.abstract"} viewed = {$article->getViews()} times
{if $galleys}
{foreach from=$galleys item=galley name=galleyList}
{$galley->getGalleyLabel()} | {$galley->getViews()} | times
{/foreach}
{/if}

(4)
In issue_toc.tpl (or article_summary.tpl) you would maybe need that line, but not at that place, but rather something like this:

{if is_a($article, 'PublishedArticle')}{assign var=galleys value=$article->getGalleys()}{/if}
{if $galleys}
{foreach from=$galleys item=galley name=galleyList}
{$galley->getGalleyLabel()} | {$galley->getViews()} | times
{/foreach}
{/if} 

in article_details.tpl, I don’t find (3) I only find

Hi @bozana,

The metrics table has the assoc_type = 1048585 and the submissions ID, its being processed correctly. What do you suggest the best way to display them?
Sorry for the misleading “page views”, I was refering to the journl views.

Thank you,
Best regards

Hi @kawahyu

Yes, your DB table metrics looks normal :slight_smile:
And yes, in order to display the abstract views you would need the getViews function in the Article class. Depending where you want to display it, you would need to change the smarty template, to add the code {$article->getViews()} assuming that the $article variable is assigned to that template.
The 3) and 4) from above is the code example, that one could insert into the smarty templates article_details.tp i.e. issue_toc.tpl in order to display the the article and galley views on the article page i.e. on the issue TOC page.

Best,
Bozana

Hi @digitojs

You would need to make some changes in the code, s. the post from kawahyu and my answer here – you would need to add the getViews function in the Article class and then call it in the wished smarty template, e.g. article_details.tpl… (I am not sure what you would need to change to consider and/or display it in the graph…)

Best,
Bozana

I am trying to understand it since I am just a journal editor.
For the following codes (3)

{translate key=“article.abstract”} viewed = {$article->getViews()} times
{if $galleys}
{foreach from=$galleys item=galley name=galleyList}
{$galley->getGalleyLabel()} | {$galley->getViews()} | times
{/foreach}
{/if}

Do I just put them at the top bottom of all codes in article_details.tpl? Or I adjust with the codes
{* Abstract *}


that I find in article_details.tpl?