Hi everyone,
this is a follow-up to a topic that was never resolved. I am a user on two OJS journal websites (Journal of Slavic Linguistics and Language), and I discovered today that the problem I was having in the linked thread is not specific to one journal. The symptoms are slightly different, but the issue looks the same, so it’s not the installation but rather the way the OJS system handles logins on networks like mine.
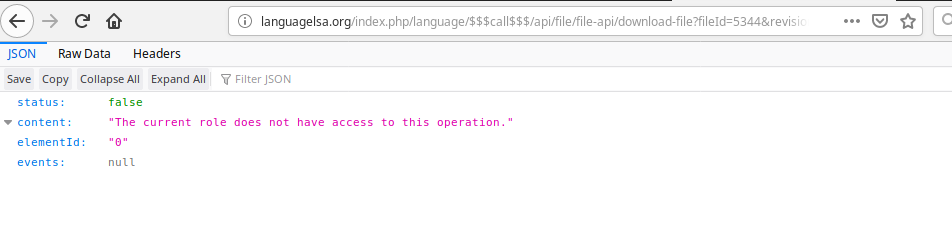
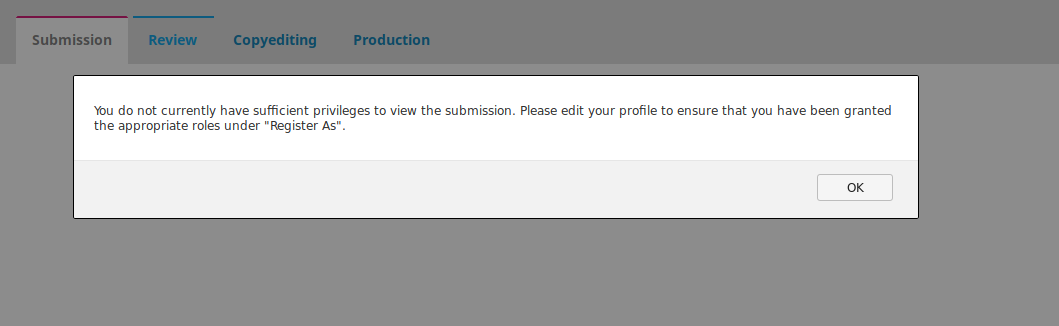
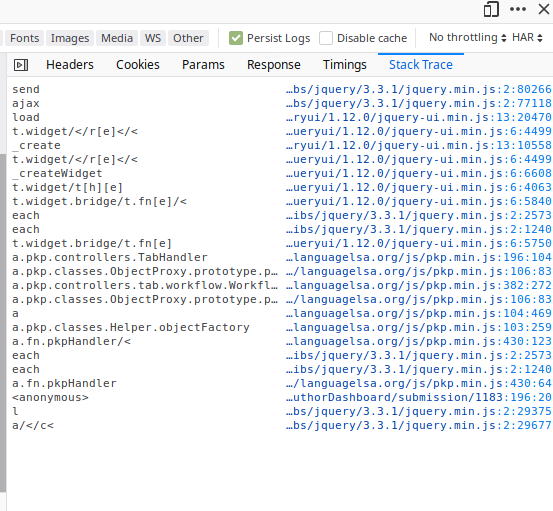
The problem I am having on the Language site (http://languagelsa.org/index.php/language/about/submissions) is it won’t let me view metadata, submission information, the PDF of the article, etc. – I get errors to the effect of “you do not have the permissions to view this content” (screenshots of what I’m seeing attached). The kicker is that this happens when I am on the satellite internet connection, but not when I am on cable/DSL/etc. I verified this by driving 5 miles over to the public library and logging in from their network on the same computer I usually use.
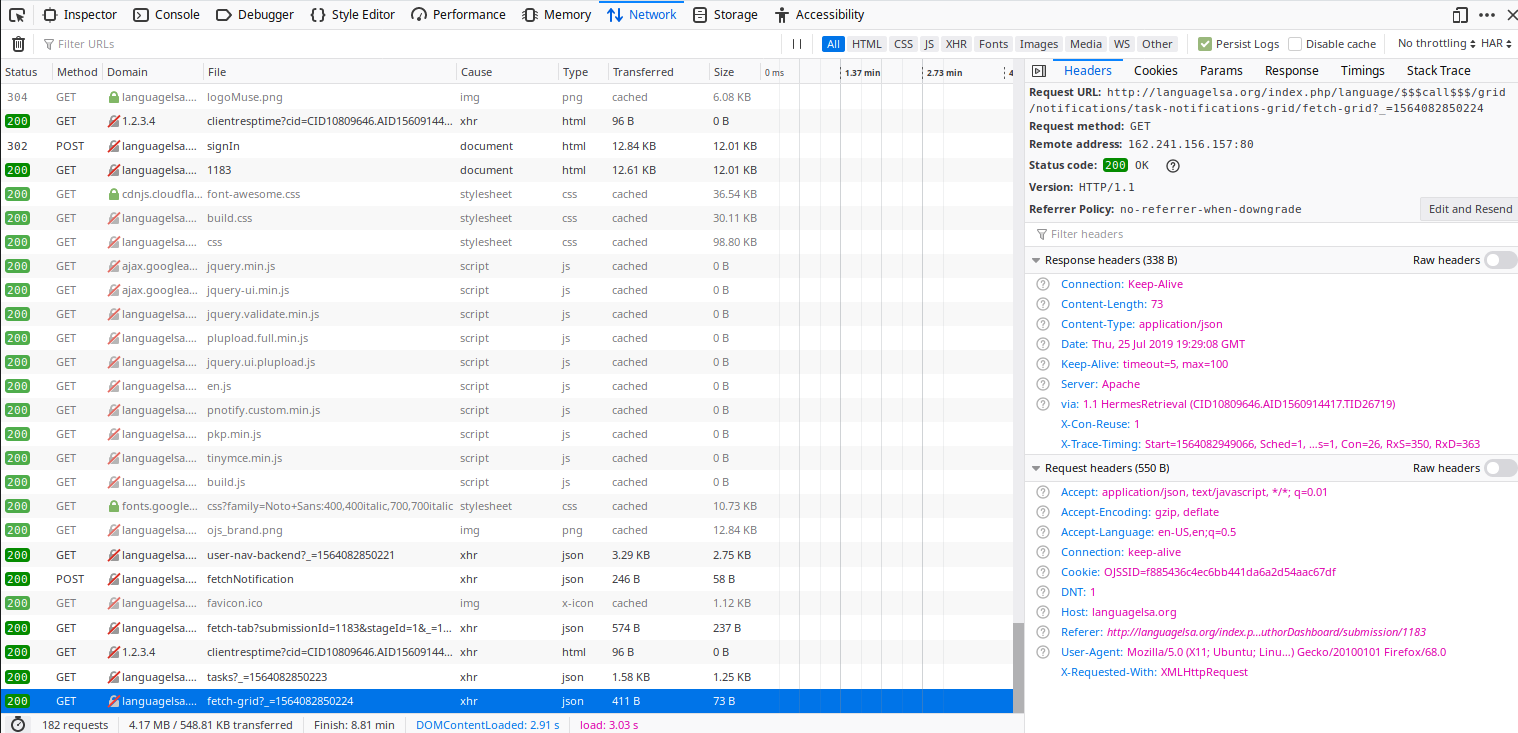
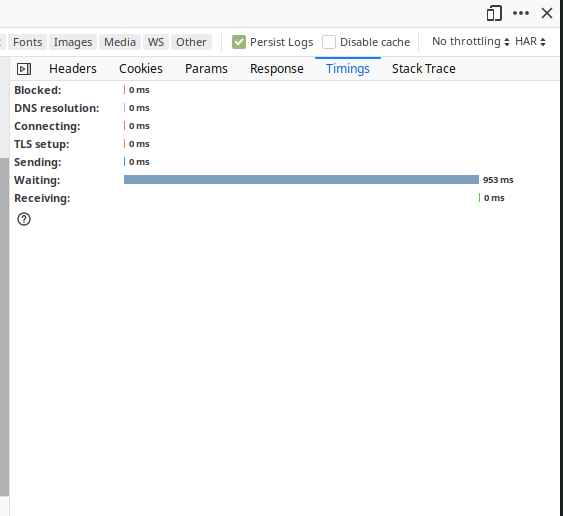
So, just a guess here: it seems that something pertaining to session management relies on a faster response than my particular network is able to provide. I can help whoever wants to look into it with debugging this–it’s unlikely that you’d be able to see the errors I am seeing if you are on a normal urban broadband internet connection.