Hi,
I like to share here some thoughts and experiences related with journal’s statistics to get your comments and debate to find a better (maybe common?) approach.
During last year I have been using 3 different tools (Plausible, Google Analytics and OJS) to get our articles’ statistics and I noticed all of them capture different information.
TL;DR;
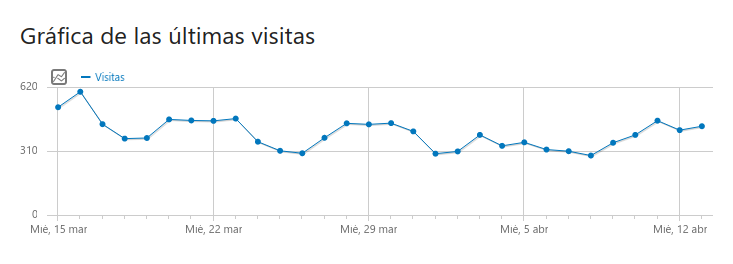
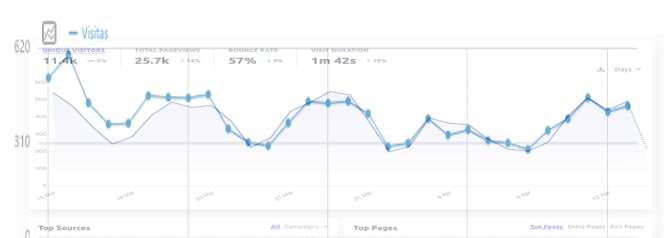
- Except for 3 anomalies, graphics show similar waves BUT…
- All statistics get different data (probably because they count different things?)
- Plausible counts 3 times more visitors that Analytics (not sure why).
- OJS counts 3 times more pagesviews than Analytics (and don’t make any sense).
- We got 3 wired spikes in OJS (discussed in Observations).
So, let me go step by step to think together why it happens, if all this make sense and maybe, help me discovering I’m doing something wrong.
Why this post?
To newcomers, let me clarify that article’s visits or pdf download metrics are not metrics to define the quality of an article/journal (because don’t say much about what happened to the article after the visit/download) but could work quite good as an indicator of visibility of the journal (and the article).
I have been playing with multiple tools to be sure I was counting correctly and with this post I also like to know if I’m misunderstanding the metrics or something is wrong in our installations or if any of OJS/Plausible/Analytics are not counting properly… because I suspect in this fourm there will be fellows more experience than us and they will like to share their knowledge.
So, let’s start. ![]()
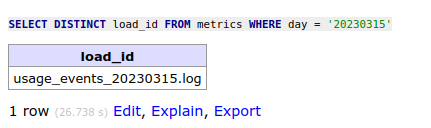
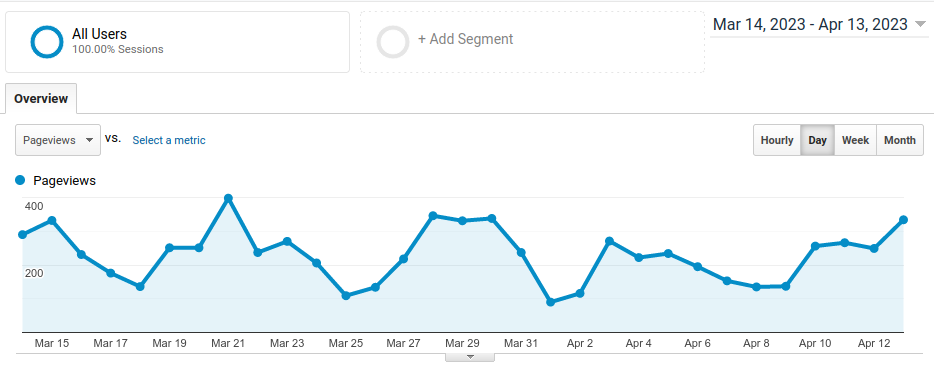
I took some screenshots of one random journal of our service with the 3 different tools I mention: Plausible, GoogleAnalytics 3 and OJS 3.2.
I thought in extending the comparative with Matomo, goAcess, AWstats… but right now those were the ones that I get more handy.
Results are…
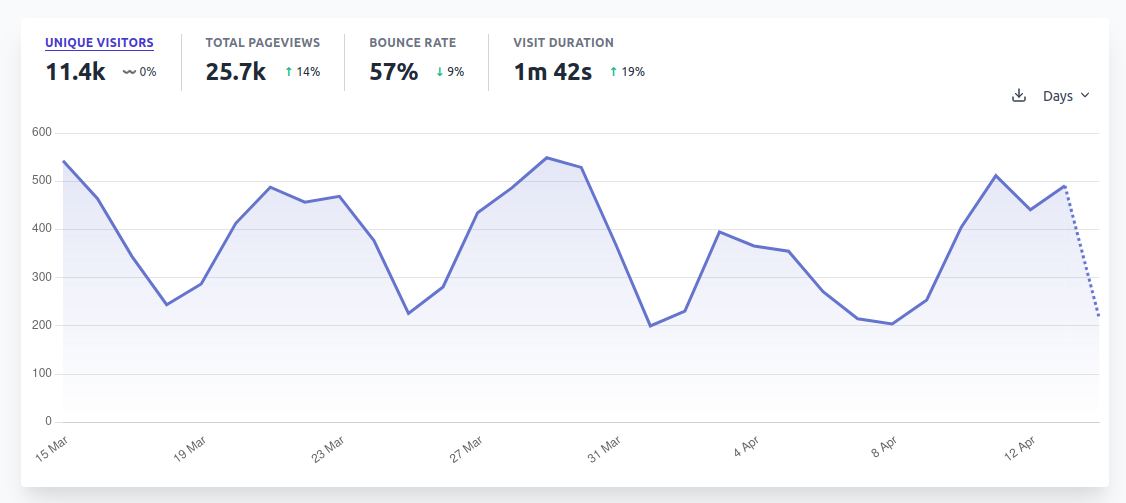
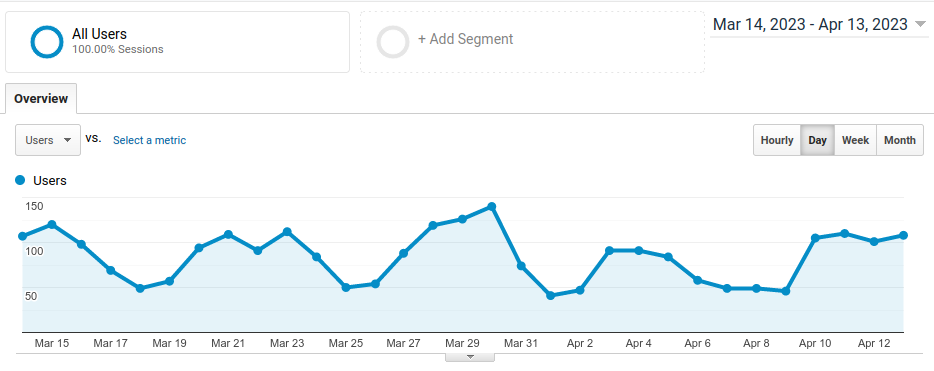
Comparative 1: Unique Visitors
Plausible (Unique Visitors) VS Google Analytics (Users)
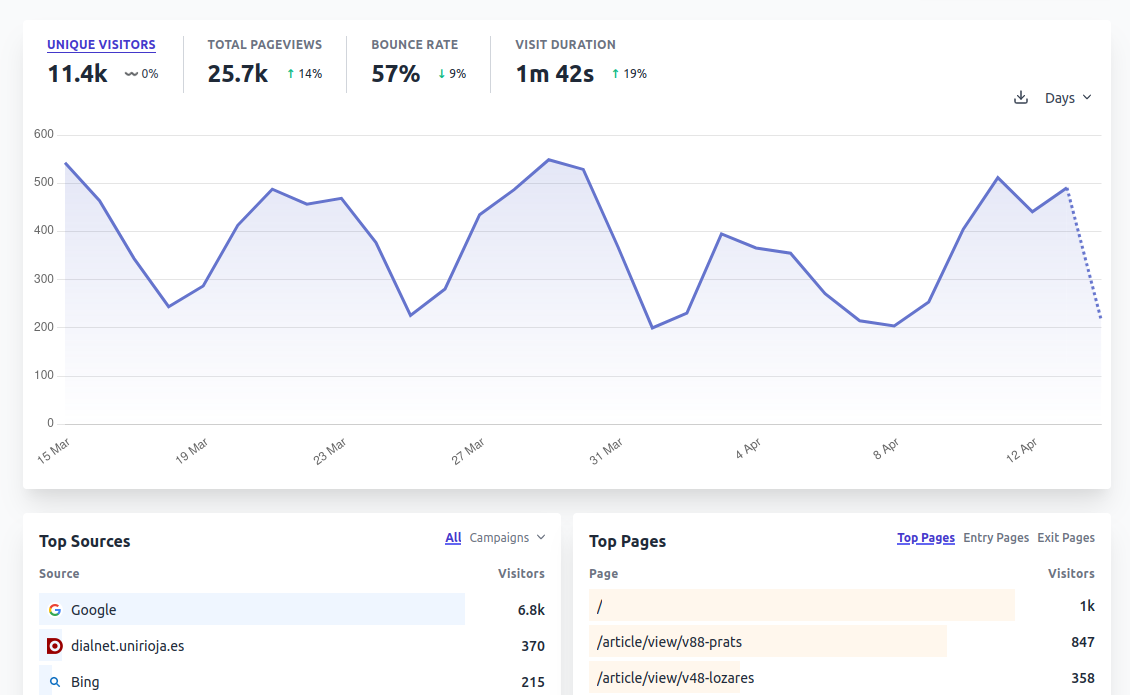
| 15/03 | 19/03 | 24/03 | 29/3 | 03/04 | 05/04 | 12/04 | |
|---|---|---|---|---|---|---|---|
| Plausible (Visitors) | 543 | 287 | 377 | 549 | 395 | 355 | 441 |
| Analytics (Users) | 120 | 57 | 84 | 126 | 91 | 84 | 101 |
Comparative 2
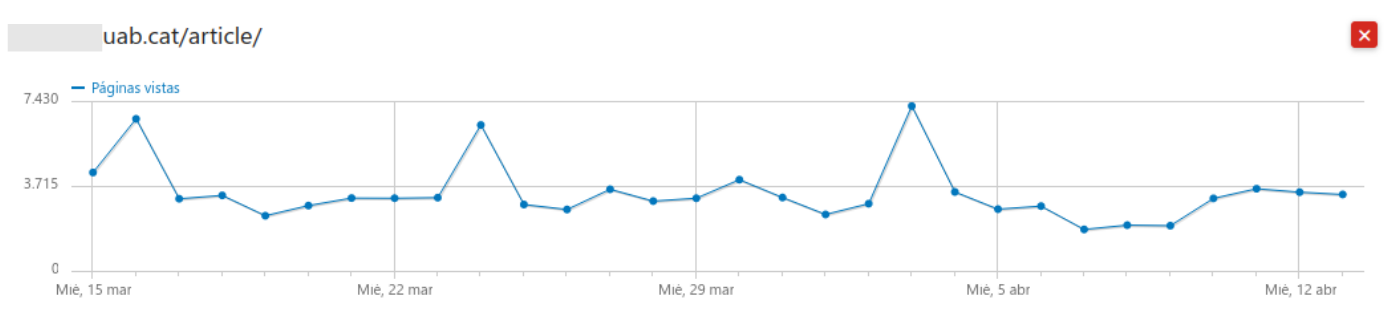
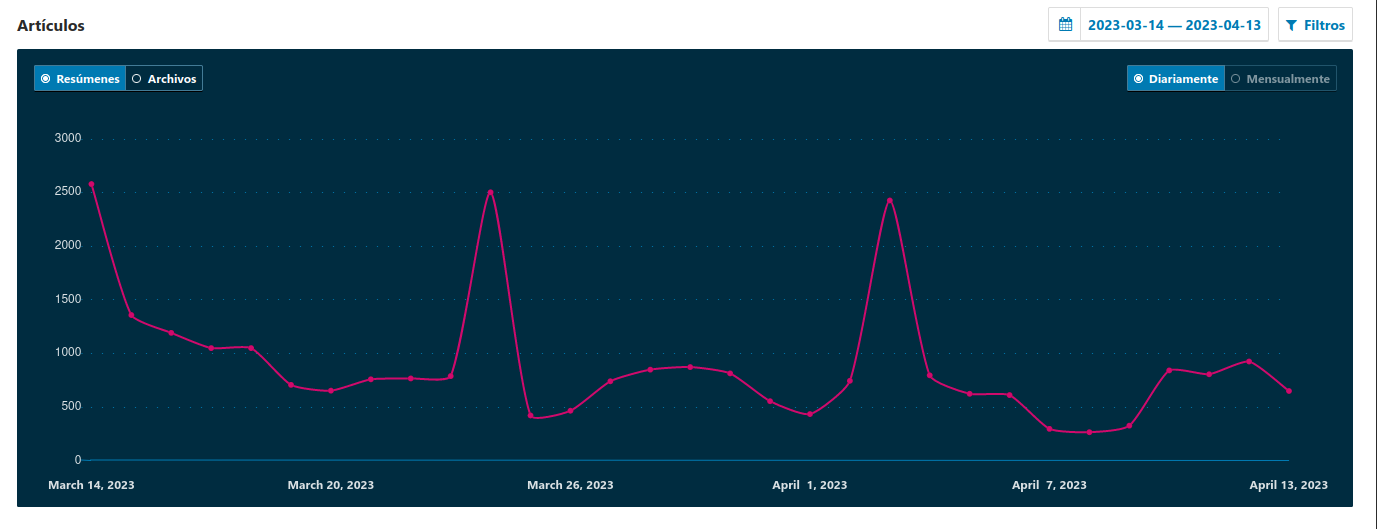
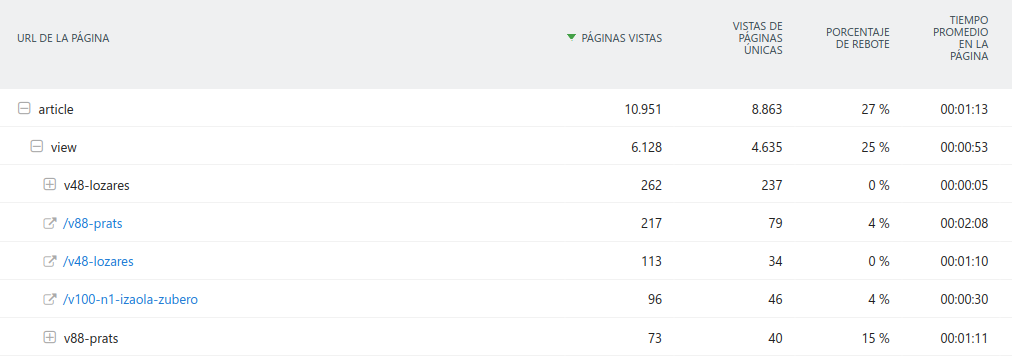
OJS (Summary page) VS Google Analytics (Pageviews)
| 15/03 | 19/03 | 24/03 | 29/3 | 03/04 | 05/04 | 12/04 | |
|---|---|---|---|---|---|---|---|
| anomaly | regular | anomaly | regular | anomaly | regular | regular | |
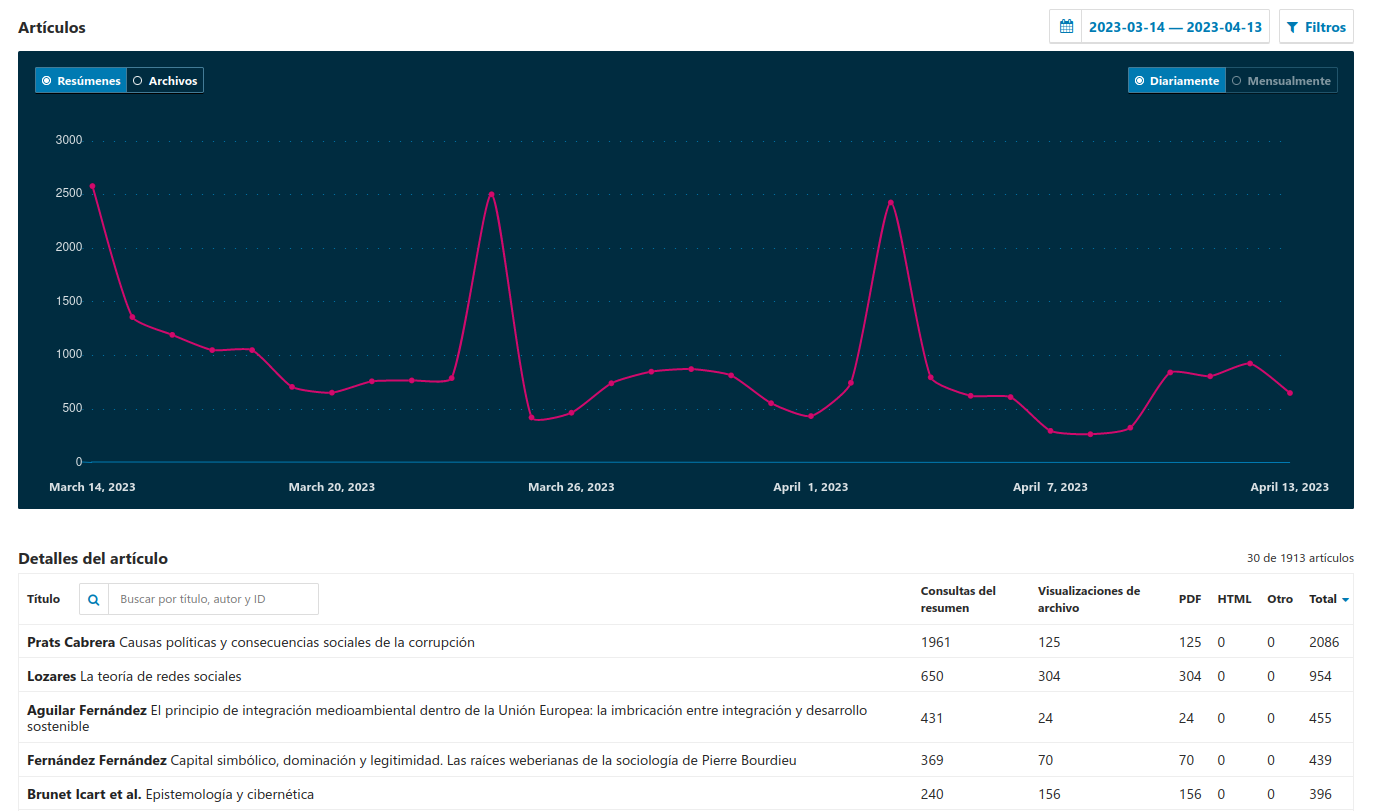
| OJS abstracts | 2580 | 908 | 2503 | 874 | 2427 | 625 | 926 |
| Analytics (Pageviews) | 332 | 251 | 206 | 331 | 271 | 234 | 249 |
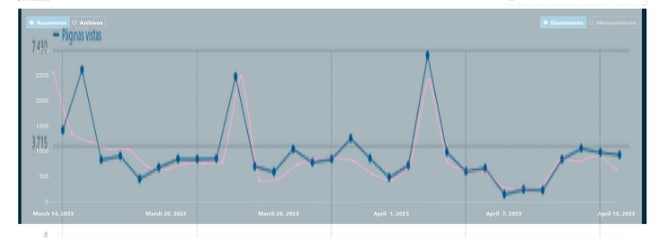
Observations
For the reasons exposed, I’m not worried (yet) about getting exact same numbers… and I’m more interested in been sure tools are always consistent (counting “whatever” but always in same way… to let us observe the tendencies) and, except for 3 anomalies (commented below), graphics show similar waves, so IMO it indicates consistency BUT some numbers don’t make much sense to me.
1. Three spikes in OJS only.
We got 3 wired spikes in OJS that are not shown in any other tool.
I have 2 theories about those peeks that are:
a) We have been crawled
Not sure what OJS is doing with spiders but if they are not filtered, it peeks could be a crawler indexing and visiting all articles of the journal. Analytics filters the crawlers and Plausible show unique visitors, so it will count them as one single visit.
b) Our installation have some trouble
Not sure how but I can imagine an scenario where I have some kind of cron/schedule misconfiguration and data is processed multiple times.
If somebody can confirm same peeks, I will open a FR to “extend OJS to ignore crawlers” (If somebody is maintaining somewhere a list of IPs so implementation looks feasible).
2. All statistics get different results
This happens because all them count different things and in a different way.
Plausible counts UNIQUE visitors, that (I think) could be compared to Analytics Users.
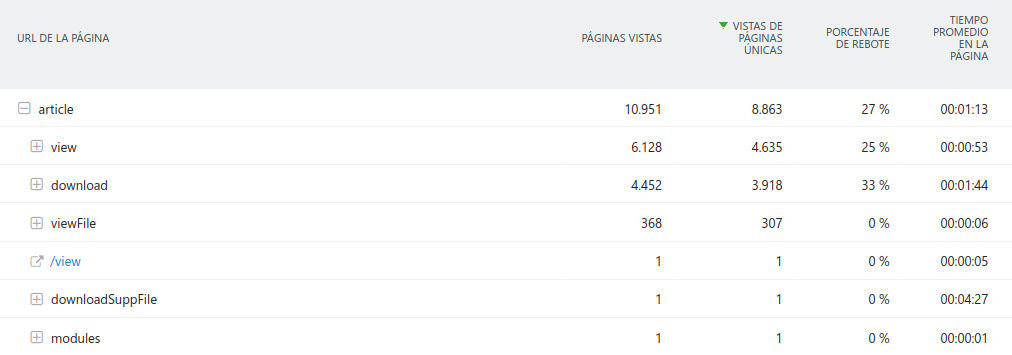
In the other hand, OJS counts visits to article’s summary (probably @bozana can clarify this) that… could be compared to GA-Pageviews?
3. Plausible counts 4-5 times more visitors that Analytics (not sure why).
| 15/03 | 19/03 | 24/03 | 29/3 | 03/04 | 05/04 | 12/04 | |
|---|---|---|---|---|---|---|---|
| Plausible (Visitors) | 543 | 287 | 377 | 549 | 395 | 355 | 441 |
| Analytics (Users) | 120 | 57 | 84 | 126 | 91 | 84 | 101 |
| Ratio (P/A) | 4,53 | 5,04 | 4,49 | 4,36 | 4,34 | 4,23 | 4,37 |
In confidence, I have no clue about why it happens.
I confirmed both (plausible and ga) scripts are loaded in all OJS pages (home, articles, pdfs, announcements…) and they are fine.
Any help about how to clarify this is welcome.
I was thinking in make some tests over a controlled environment (only visited by us) or install one or two new tools (Matomo, goAccess…) to compare them all and discover who is lying.
4. OJS counts 2-3 times more pagesviews than Analytics
This case is even more wired… because OJS is only counting summary pages and GA is counting every pageview, so GA should be bigger than OJS counting, not the opposite.
| 15/03 | 19/03 | 24/03 | 29/3 | 03/04 | 05/04 | 12/04 | |
|---|---|---|---|---|---|---|---|
| anomaly | regular | anomaly | regular | anomaly | regular | regular | |
| OJS abstracts | 2580 | 908 | 2503 | 874 | 2427 | 625 | 926 |
| Analytics (Pageviews) | 332 | 251 | 206 | 331 | 271 | 234 | 249 |
| Ratio (O/A) | 7,77 | 3,62 | 12,15 | 2,64 | 8,96 | 2,67 | 3,72 |
If we ignore the spikes (commented in 1) OJS is counting 2-3 times more pageviews than Analytics.
The only theory I have here is users are visiting this journal with anti-tracking tools so it will explain why OJS (even Plausible) are getting more visits than Analytics.
Questions
So, final questions are:
- Why OJS is counting more than Analytics?
- Why Plausible is counting more than Analytics?
- Why are we getting those spikes?
- Could we define a method to “standarize” the way we take statistics from our journals?
- Which tools is more reliable?
I look forward to your comments.
Thanks for your time,
m.