When I want to visit " Statistics > Editorial Activity" in my admin dashboard, It gives me the HTTP 500 error. Everything else is working fine. I can generate all the reports through “Tools > Report Generator” as well.
In PHP error log it throw the following: [26-Oct-2020 14:02:33 America/New_York] PHP Fatal error: Uncaught PDOException: SQLSTATE[42000] [1203] User xxxxxx already has more than 'max_user_connections' active connections in /home/seisense/journal.seisense.com/lib/pkp/lib/vendor/illuminate/database/Connectors/Connector.php:70 Stack trace: #0 /home/seisense/journal.seisense.com/lib/pkp/lib/vendor/illuminate/database/Connectors/Connector.php(70): PDO->__construct('mysql:host=loca...', 'xxxxxx', 'xxxxxx) #1 /home/seisense/journal.seisense.com/lib/pkp/lib/vendor/illuminate/database/Connectors/Connector.php(46): Illuminate\Database\Connectors\Connector->createPdoConnection('mysql:host=loca...', 'xxxxxx', 'xxxxxx) #2 /home/seisense/journal.seisense.com/lib/pkp/lib/vendor/illuminate/database/Connectors/MySqlConnector.php(24): Illuminate\Database\Connectors\Connector->createConnection('mysql:host=loca...', Array, Array) #3 /home/seisense/journal.seisense.com/lib/pkp/lib/vendor/illuminate/database/Connectors/ConnectionFactory.php(182): Illuminate\Database\Connectors in /home/seisense/journal.seisense.com/lib/pkp/lib/vendor/illuminate/database/Connection.php on line 664
In search of a solution, I have seen a similar post below on the forum yet I am posting it as there was no follow up on the question afterward. Is this possible that when I can visit all the pages and reports in the dashboard without any error then why only this report shows this particular error?
Hope you will guide me in the right direction to sort this problem out.
My OJS version is 3.2.1.1
Thanks
I asked my host to increase the ma_user_connection and received the following reply.
“max_user_connection” limit is a server global one and cant be modified on the shared server due to security reasons."
I don’t know how it works but I have one more installation of OJS on a subdomain (same host, same server) and it is working fine there.
Looking forward to your guidance.
Thanks
I as following up with the host and got the following reply:
“Unfortunately, we are not familiar with ‘Open Journal Systems’, so we will not be able to troubleshoot the issue, unless we know the possible reasons of the issue.
We can only recommend you to contact developer of this software or their support for assistance, perhaps they will be able to provide some suggestions on the reasons of this issue.”
Anyone can shed some light if there is something specify I should ask to enable or disable to resolve this fatal error.
Thanks
We had a similar problem. We found that bots where hitting our sites quite hard at certain times.
changing the robots.txt file helped a bit but we still have problem from time to time. Below is the contents of our robots.txt. If the bots respect the robots.txt file they should delay their hits for 60 seconds. You can check out your sessions table to see how that’s progressing. I find it easier then looking at logs.
Thanks, @jhennig for sharing your experience. I edit the robots.txt file but it did not help.
and @asmecher, I created the two indexes by running the SQL query yet I can not run this report.
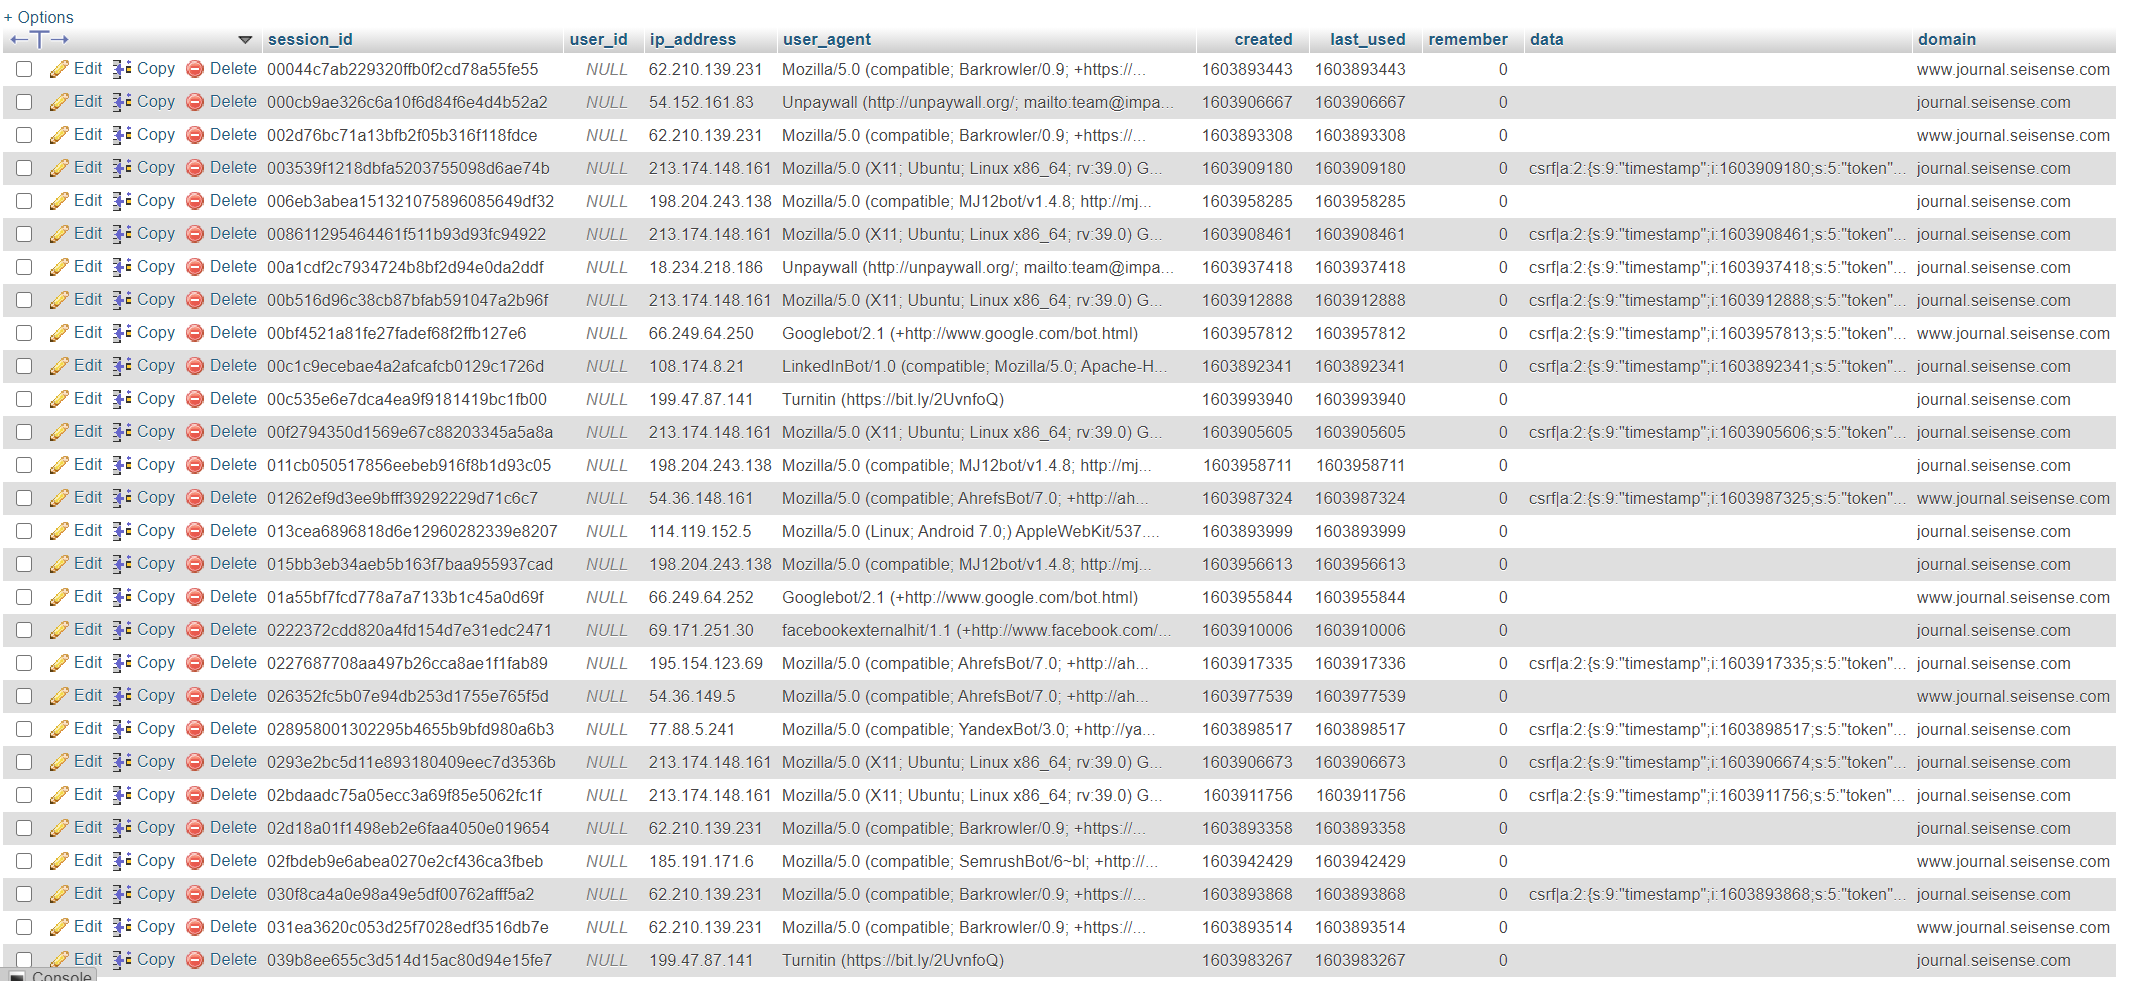
Below is the snapshot from the session table. Do you see any suspicious activity here?
Our sessions table hit close to 20,000 records in 2 days so it was a quick and easy way to see which bots were causing problems. I’m not sure how often a bot will read the robots.txt file so you may want to give it more time. You could of course block IP addresses if you want. We have not yet gone down that path.
Just FYI this query will convert the last_used/created at times to human readable format:
SELECT 	session_id,
user_id,
ip_address,
user_agent,
FROM_UNIXTIME(created) AS created,
FROM_UNIXTIME(last_used) AS last_used,
remember,
`data`,
domain
FROM 	sessions
WHERE last_used > UNIX_TIMESTAMP('2020-10-29 12:00:00')
Thanks, @asmecher and @jhennig for your offered solutions.
Yet there is something further I want to share about the fatal error now:
I have a single journal on the OJS installation where I am facing this issue. So, I created the second journal to see if this problem happens in the second journal as well or not.
Interestingly, the new journal is running the “Statistics > Editorial Activity” report without any issue.
How do you see this new development? Where should I look further to solve this fatal error?
Thanks
For knowledge base
I have two journals in my OJS installation. After upgrading OJS from 3.2.1.1 to 3.2.1.3, one of the journals started running the " editorial activity" query yet the other journal was throwing a fatal error.
Now, when I upgraded OJS from 3.2.1.3 to 3.3.0-3, both the journals are working fine and generating an " Editorial Activity" report.
So, the problem is resolved with the upgrade.
Thanks