OJS[3.1.2.4] - Blank Statistics Graph

Hello, sorry for my bad english

I have the following problem with OJS 3.1.2.4, the following statistics section is blank in a while ago here.

I have seen the following FAQ’S:

However, this has not helped me. Below I describe what I have visualized so far.

This is the ojs where I have the problem, at the moment the section where the graph of the usage statistics should be shown is blank

This is how the graph should look without any problem, it belongs to another OJS

I have looked at the metrics table, to verify if the data has been inserted, however, I do not see the record of 1 day ago

Similarly, I see that a log is in the UsageEventsLog folder

Any suggestions on how I can solve this problem?

Hola!

Revisa:

  1. Que en el config tengas habilitada la variable schedule_task
  2. Que el módulo de estadísticas tenga habilitada la opción de “Mostrar gráfica”

Gerardo T

Hola @gtibana, he revisado los (2) items que mencionas, sin embargo lo contrasté con otro sitio que tengo en funcionamiento y que este módulo no presenta fallas, este sitio tiene la variable: scheduled_task = Off y la opción de “Mostrar gráfica” en el módulo ya estaba seleccionada; tal cual como está en el sitio que presenta fallas en este módulo

Posiblemente tienes alguna otra sugerencia?

Hola Alex2394,
Ya revisaste si tienes el módulo acron y si esta activado? este modulo permite lanzar las tareas cron que generan las estadísticas.

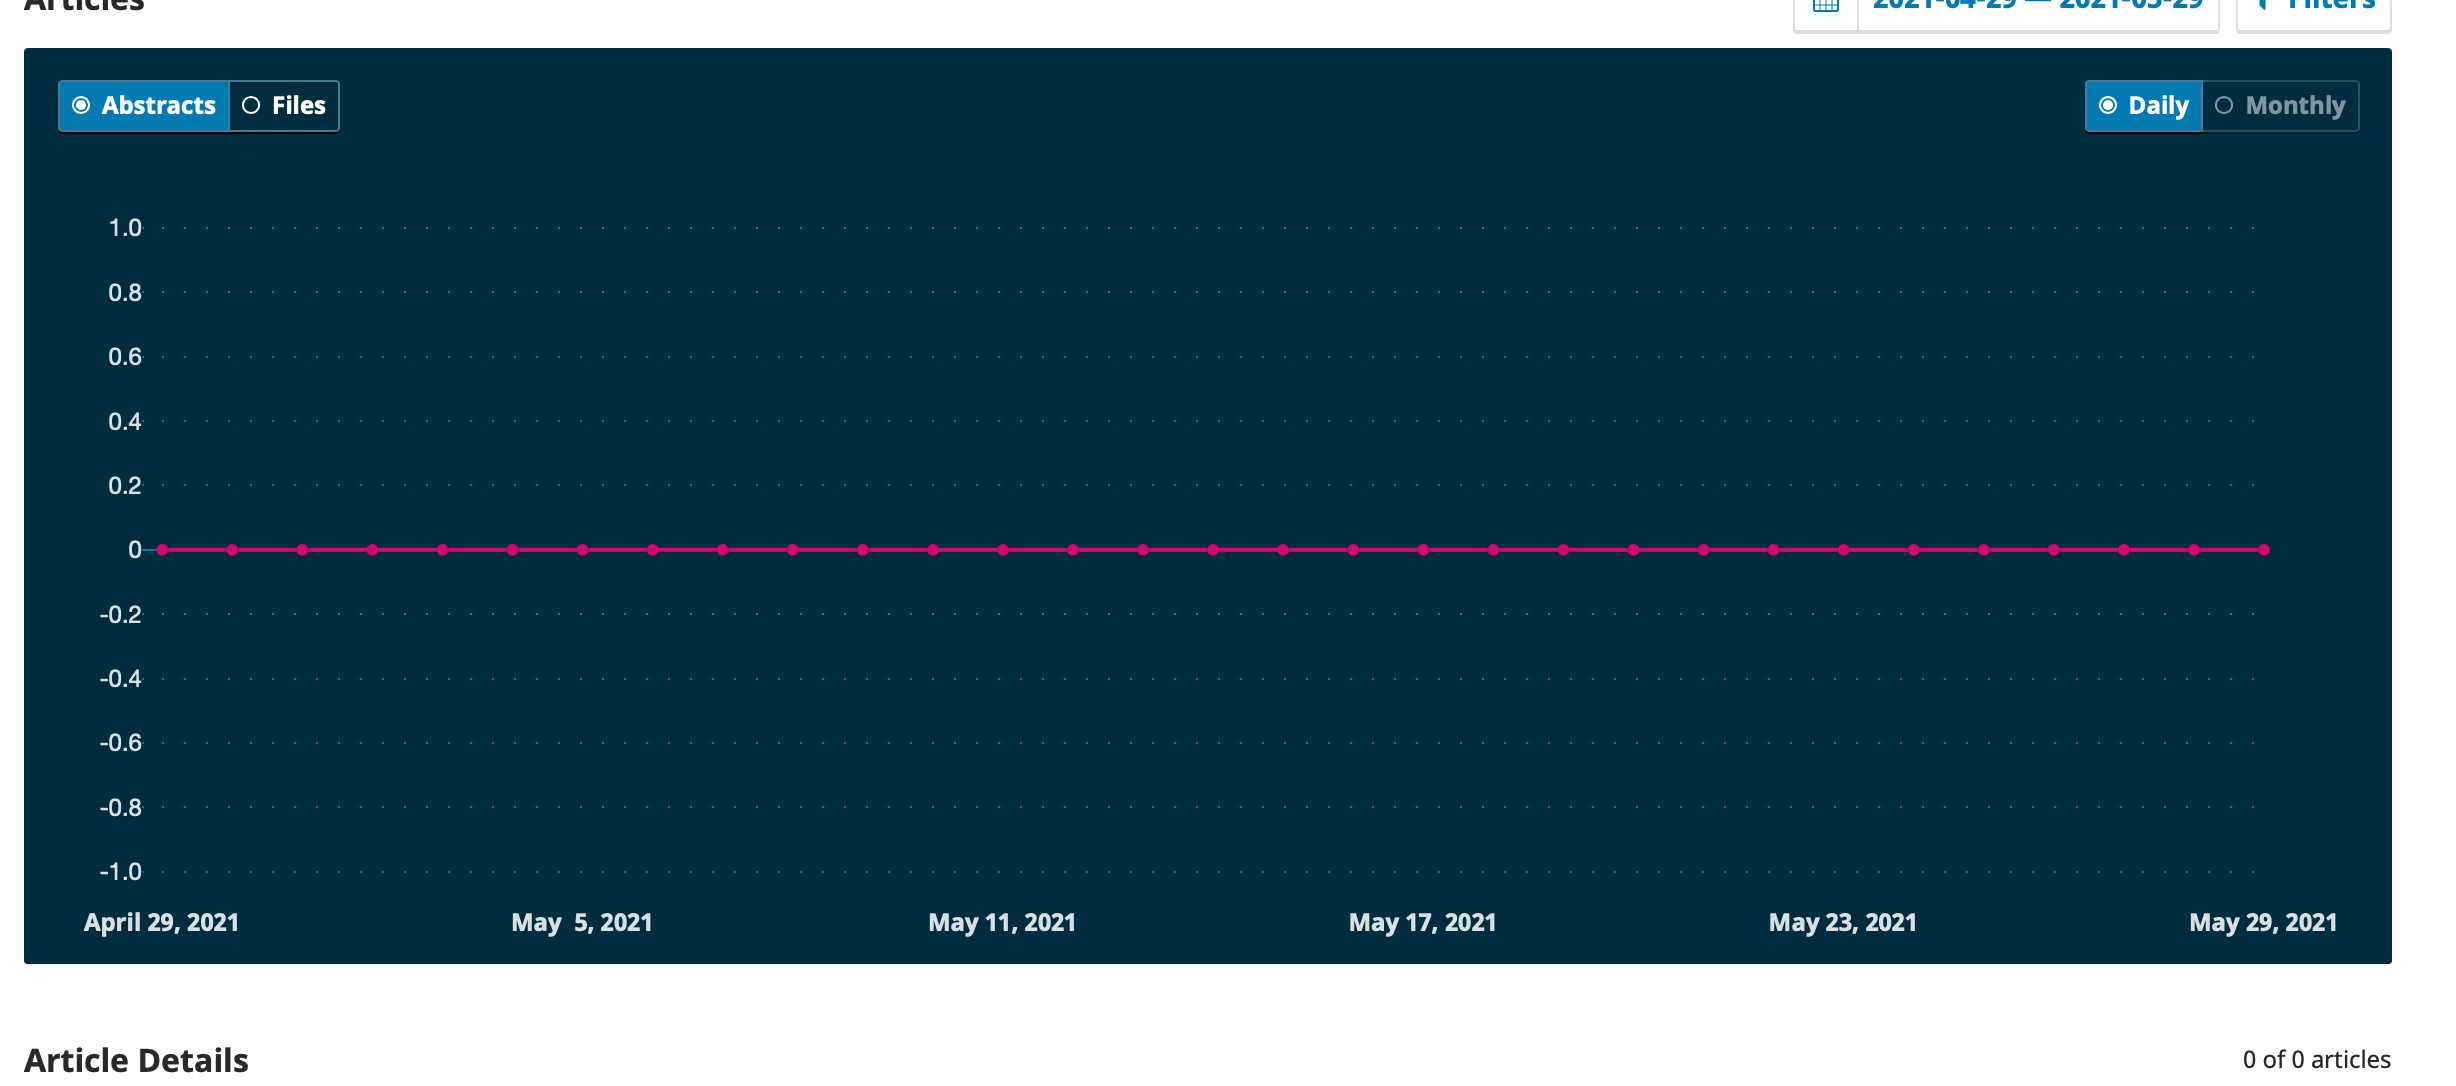
Hi, my journal has a sam problem, has show blank statistic graph, also in statistic page in abstract and file wiev shows no user metrics, what i need to do? I turn ON “Scheduled Tasks” but still same problem. I put two photos

Screen Shot 2021-05-30 at 12.14.40
Screen Shot 2021-05-30 at 21.39.32

Hi @thelaris,

Can you post your question to a new post, please? And, feel free to link back to this post. Please indicate the version number of your OJS instance in your new post as well.

Best regards,

Roger
PKP Team