Hi all.
This is the problem:
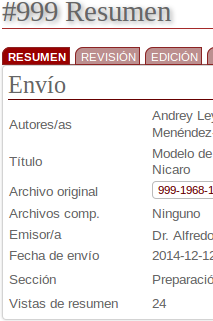
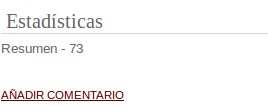
1.- The system log files only have the abstract views, not the download PDF files (ZERO). The results are in the imagen
2.- timed_views_log table is empty.
3.- metrics table only have ojs::legacyCounterPlugin, ojs::legacyDefault and ojs::counter type, there is not ojs::timedViews record.
4.- Statistical charts plugin shows total download PDF files by month and year, it use information in the counter_monthly_log
My question is:
How I can solve the problem with statistics of the download PDF files?
How I can obtain the total download article before and after the upgrade? I need to show this number in the article page.
The tables timed_views_log and counter_monthly_log should have been dropped from the database in favor of the metrics table by the upgrade process after 2.4.3. You shouldn’t expect to see them in OJS 2.4.7.
What is your upgrade history? (You can find it in User Home → Site Administrator → System Information)
Do you have any record or recollection of seeing any error after running the database upgrade following an update of the OJS files?
The upgrade history is…
2.3.4.0
2.4.2.0
2.4.7.1
The database upgrade was OK, the counter_montly_log table is used by the statiscCharts plugins, that show the total number of download article by month and year that is necessary to show the download history of the journal, not only by article.
yes, the system administrator do, this is the temp solution to the problem.
Are there incompatibility with metrics concept? If we dropp the statisticChart plugin the problem with statistic of download PDF is solved?
After 2.4.3, only metrics will be collected. In the upgrade to 2.4.7-1, all old statistics should have been converted to metrics. I suspect your administrator has modified the .php or .tpl files to try to add the Views count back in after the upgrade. This will need to be based on the new metrics.
See this earlier conversation for some code suggestions:
We have made the modification to show the abstract view, based in the code that you suggest, but in the case of download files the value is 0, and is not implemented.
I notice that in the system log files only abstract views are colected.
I need to solve the situation. Why in the log files the downloads articles are not colected?
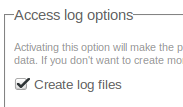
There are a couple of different ways to collect usage events in the latest versions. One should be automatic: the generic plugin “Usage Statistics” in concert with the generic plugin “Acron”. The other is manual processing of your webserver’s log files.
Do you know which method is active for you? Check if both the “Usage Statistics” and “Acron” plugin are enabled; if you have disabled one or the other, have you created specific cron jobs for processing the log files?
If you are looking at your webserver’s access log and not seeing the article galley views, that is odd. Note that the URL will be very similar to the abstract view - with just an additional galley id behind the article id.
If you look in your ‘files_dir’ location for the folder ‘usageStats’, do you see a couple of current files (today and yesterday) in the usageEventLogs folder, and a lot of daily files in the ‘archive’ folder?
If you look at a file in the usageStats/archive/ folder, you see no URLs of the form [$journalUrl]/index.php/[$journal]/article/view/[$articleId]/[$galleyId] ?
If you access an article galley now, do you see that recorded in your current log in usageStats/archive/ ?
No, all have the form [$journalUrl]/index.php/[$journal]/article/view/[$articleId] 200
I dont have access in this moment to the log in the server (generated today), but I have the log files of this month, and all of then have the same form.
I can’t think of a reason those urls wouldn’t be captured in both your usage stats log and in your Apache access log.
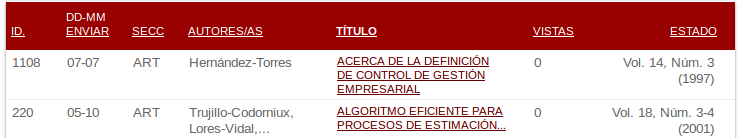
I just downloaded article 1203 twice. Once directly and once with a unique string after the galley id: “w95465MFJ4836Ns87m56e53Kv4N5h9PY”. You wouldn’t expect to see that unique string in the usage stats log, but you should at the very least see it in your webserver’s access log. The datestamp will be around 11:30 Eastern, today.
Can you provide snippets of your webserver access log and of your usage stats event log for that time?
To ensure accurate statistics, you will need to clear the data from the faulty logs from the metrics table, by load_id (the filename). If you have a load from the usageEventLogs and from the Apache logs for the same day, you will be double-counting some statistics.
Yes, in this moment our system admin is maken some test in a secondary server.
I have another question.
It is possible to have a code, similar to this Abstract views, PDF views and Download Stats Made Public 😶 - #6 by Dein, in order to show pre- and post-upgrade statistic by article.