I don’t see any of the new error log lines in either output. I would expect to at least see:
[error] [client ***] Templates::Article::Main calls PlumAnalyticsPlugin::insertWidget
[error] [client ***] Called insertWidget from Templates::Article::Main
[error] [client ***] $output is 0 bytes
[error] [client ***] DOI is
[error] [client ***] returned falsish
Is it possible this log comes from before the PlumAnalyticsPlugin.inc.php change was made?
No, both logs are made after PlumAnalyticsPlugin.inc.php modification.
I’m afraid that I’ll have to disable the script call in the plugin and hard-code it in the page header. I don’t understand why the plugin behaves selectively on different articles… There is little sense in this kind of plugin  And we need the correct operation of this metric tool…
: (
I think you were my best hope to finding out what is causing this.
I suggest that we wait for bugfix release OJS/OMP 3.1.2-2 Milestone · GitHub and check that suddenly the error disappears in it. And if not, then I just don’t know what else to do. If the plugin did not work at all it would be much more understandable…
We are seeing the same issue as well since our upgrade to 3.1.2 . Info that might be helpful in troubleshooting:
-we had the widget set to “hide when empty”, and to present the “summary”.
-On some articles, the widget did not display (as expected for empty results). For articles where it did display, but presented the “No Metrics Available” message, clicking on the “see details” link in the summary box showed that there were actually metrics available.
-changing the widget settings to “details” resolves the issue and displays metrics. This article was displaying the No Metrics available in summary view, but is fine with details view enabled: Comparison of peer-tutor and librarian feedback for the literature search component of a medical school research course | Journal of the Canadian Health Libraries Association / Journal de l'Association des bibliothèques de la santé du Canada
Not sure if this helps!
Thanks, @Sonya_Betz. Did you (do you) have any cases where the widget is not set to “hide when empty” but the widget still does not display? This is the issue I think we were tracing earlier.
The issue of a “No Metrics Available” message when there were metrics available sounds new to me. Are you able to reproduce this issue currently? I tried assigning the same DOI in a test journal, but the widget displayed with settings of “summary” as well as with “details”.
Yes - this DOI consistently displays “no metrics available” in the summary view, but has 8 tweets that show up in the details view: https://doi.org/10.29173/jchla29391
This DOI consistently displays metrics in both summary and details view:
https://doi.org/10.29173/jchla29386
I have confirmed the issue with 10.29173/jchla29391 and reported it to Plum Analytics support.
In our situation, we have strictly such settings:
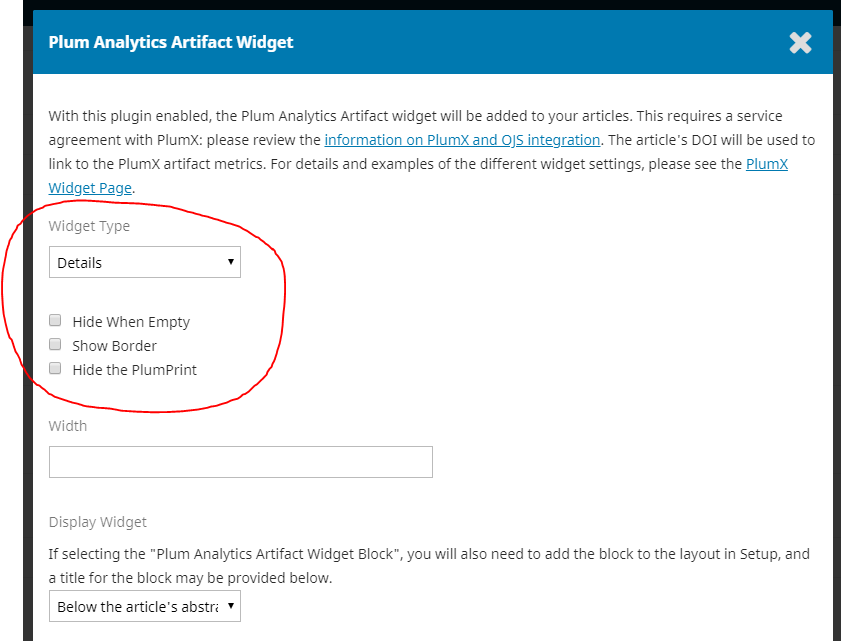
And they do not solve the problem.
We just upgraded OJS to 3.1.2.3 and PHP to 7.3.10, plumAnalytics plugin version 1.3.0-0. I checked everything carefully and did not find any problems in its work now 
Those articles that previously had problems now work perfectly. @ctgraham, thank you very much for your help, I hope now everything will be fine in the future.